
What COGS includes – and why contribution margin decides
“What does this order actually cost me?”
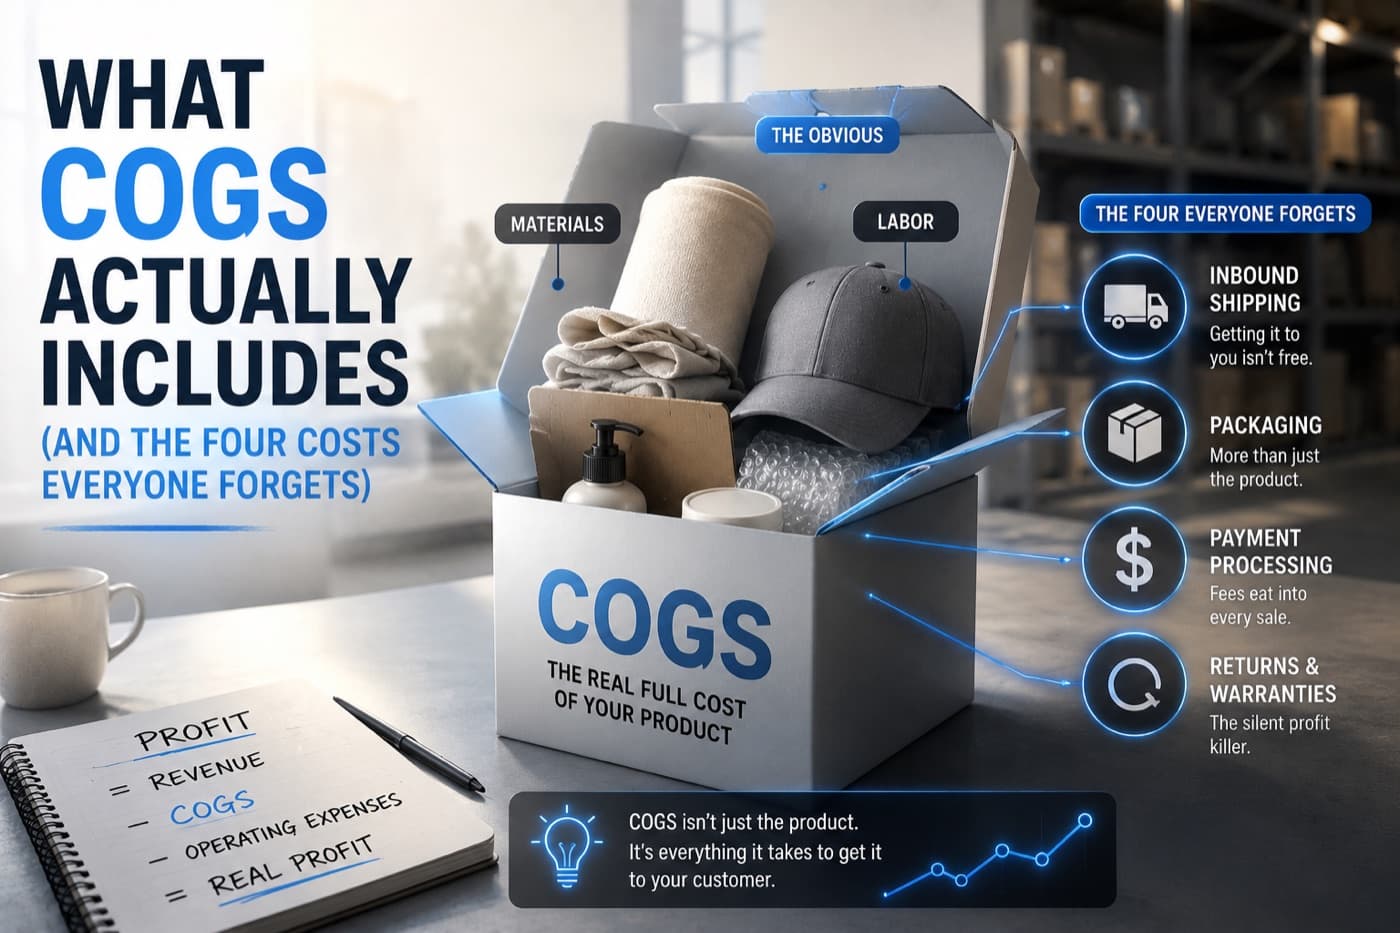
Break-even ROAS, LTV, contribution margin, the profit number on any dashboard – all of them start from what an order costs you. Get that figure wrong and everything downstream is confidently, precisely wrong. It is also the least glamorous number in the business, which is why it usually is.
The number most people use is the invoice price
Ask an operator what a product costs and they will usually quote what the supplier charged. That is the purchase price, not the cost of goods. The cost of goods is everything you spend to put that item in a customer's hands, and much of it never appears on the supplier's invoice.
The four that get forgotten
| Cost | Why it is missed | Where it hurts |
|---|---|---|
| Landed cost | Freight, duty and customs arrive as separate invoices, months apart, and never per unit. | Understates cost on imported goods by a wide margin. Divide each shipment's freight and duty across the units it contained. |
| Returns | Treated as a rate to worry about, not a cost per order. | A returned order costs you outbound shipping, return shipping, handling, and often the item. It does not just cancel – it goes negative. |
| Payment fees | Deducted at settlement, so they never touch the product record. | 1.5–2.9% plus a fixed fee. On a low-value order the fixed fee alone can be several percent. |
| Discounts actually redeemed | Margin is calculated on list price because that is what the catalogue says. | If a fifth of orders use a 15% code, your real average selling price is 3% below list – permanently. |
Building the number
price − discount − landed COGS − payment fees − fulfilment − expected return cost
€899 order, 6% average discount, €280 landed cost, €20 payment fees, €45 pick-pack-ship, 12% return rate costing €90 each: 899 − 54 − 280 − 20 − 45 − 11 = €489, a 54% contribution margin. The headline “69% margin” from price minus purchase cost was fifteen points optimistic.
- 1Take the last 12 months of purchase invoices and total the freight, duty and clearing per shipment.
- 2Divide each shipment's landed extras across its units to get a true landed cost per SKU.
- 3Pull actual payment fees from your processor's settlement report, not from the published rate card.
- 4Get fulfilment cost per order from your 3PL invoice, or estimate honestly if you pack yourself – your own hour is not free.
- 5Compute return rate per category from real order data, then multiply by what a return actually costs you.
- 6Subtract the average discount actually redeemed, not the discount you intended to offer.
Blended or per-product?
A single blended margin across the catalogue is fine while your products have similar economics. It stops being fine the moment your mix varies by channel – and it usually does, because different ads sell different products.
The uncomfortable part
Doing this properly usually reveals that some products lose money on every order, and that they are often the ones the ads promote hardest, because a low price converts well. That is not a reason to avoid the exercise. It is the entire reason to do it.
In short
- ✓Cost of goods is everything that scales per order, not the supplier's invoice.
- ✓Landed freight, returns, payment fees and real discounts are the four usually missing.
- ✓Free shipping belongs in cost of goods, not the marketing budget.
- ✓Blend margins only while your products' economics are within about ten points.
- ✓Expect the exercise to expose a bestseller that loses money. That is the point.
Where this method runs out
Everything above works in a spreadsheet. Keeping it current, and matching every order back to the ad that actually caused it, is the part that does not. That is what Kepra does – and the demo runs on sample data with no signup, so you can judge it before believing any of this.
Open the demo →Read next
Break-even ROAS: when an ad is actually working
Most advertisers judge ads against a ROAS target someone guessed. Here is how to derive yours from gross margin in one line, and why a 3.0 target can be.
Your first 30 days of profit tracking
A week-by-week plan to move from platform-reported ROAS to a profit number you trust – using tools you already have.